Português
  Back
Back
Install Tracker: from an in-game event to the globe spinning in our office
 By Paulo Cavalcanti, Associate Data Engineer · August 2026
Install Tracker: from an in-game event to the globe spinning in our office
Event streaming, atomic writes, replay mode, and a globe built in Three.js. The architecture of an application that can't stop
Three firsts at the same time
First internship. First time living in São Paulo. First contact with Data Engineering. At the end of 2024, all of that happened at once, and I still remember the nerves of showing up on day one knowing that this was where I would find out whether everything I had learned at university actually worked outside of it.
Spoiler: it did. Just not in the way I imagined.
My name is Paulo and I have a degree in Computer Science from UFCG, in Campina Grande. I joined Wildlife Studios as an intern on the data team, and I'm still here today, hired full time as a junior data engineer in the same area. This article is about how that transition happened, and about one of the projects that shaped my path the most so far.
How I got here
Before Wildlife, my only professional experience was at a university lab, Bra.in, which has a partnership with the company. There I worked on internal projects, mostly focused on backend and testing. In practice, I was already solving problems close to the company's before I knew anyone on the inside. That work is what caught my manager's attention, and the invitation came with a challenge attached: he thought it would be interesting for me to get to know data engineering.
I had no previous experience in the field and I still didn't know exactly what to expect. The opportunity showed up, and I decided to take on the challenge.
First experiences
The first three months of the internship were on site, in São Paulo. It was a stretch of many firsts happening together: a new city, a new company, and a field completely different from what I had studied until then.
What made the adaptation possible was the way the team welcomed me. From day one, people helped me understand the company's data flow: where the data was born, how it was processed, and how it reached the people who needed to make decisions. More than introducing tools and processes, the team shared context. I learned from the experience of people who had already faced the same challenges, made mistakes, and found solutions before me. Being surrounded by people who are very strong technically but also willing to teach sped up my learning in a way no course could.
That was when I started picking up my first real tasks: optimizing SQL and Spark queries to improve the performance of some dashboards. It may look like a small change from the outside, but that's where I understood in practice how data engineering supports the daily life of the people making decisions at the company.
After those three months, I went back to Campina Grande and continued the internship remotely while finishing my degree. But it was still early on that the project which would become one of the most memorable parts of my story here showed up.
The Install Tracker: the project that became mine
Anyone who walks into the Wildlife office passes a cube of four TVs right at the entrance. On one of them, a 3D globe spins slowly, with points of light appearing scattered across the map. Each point represents an install of one of our games happening somewhere in the world, almost in real time. And at the top of the screen, a worldwide download counter follows that movement, climbing as new players arrive in our games.
This application is the Install Tracker, the project I became responsible for during my internship.
The idea for the project existed before me. At some point a first version was built, but over time it faded and eventually stopped being part of the company's routine. When I arrived, I was given the mission of reviving that idea, rebuilding the solution, and taking end to end ownership of it. And the goal wasn't just to get data onto a screen. It was to turn millions of events happening inside our games into an experience anyone could understand in a few seconds while walking through the office.
How it works behind the screen
For that, the architecture had to be simple, reliable, and able to run continuously on a TV in the office.
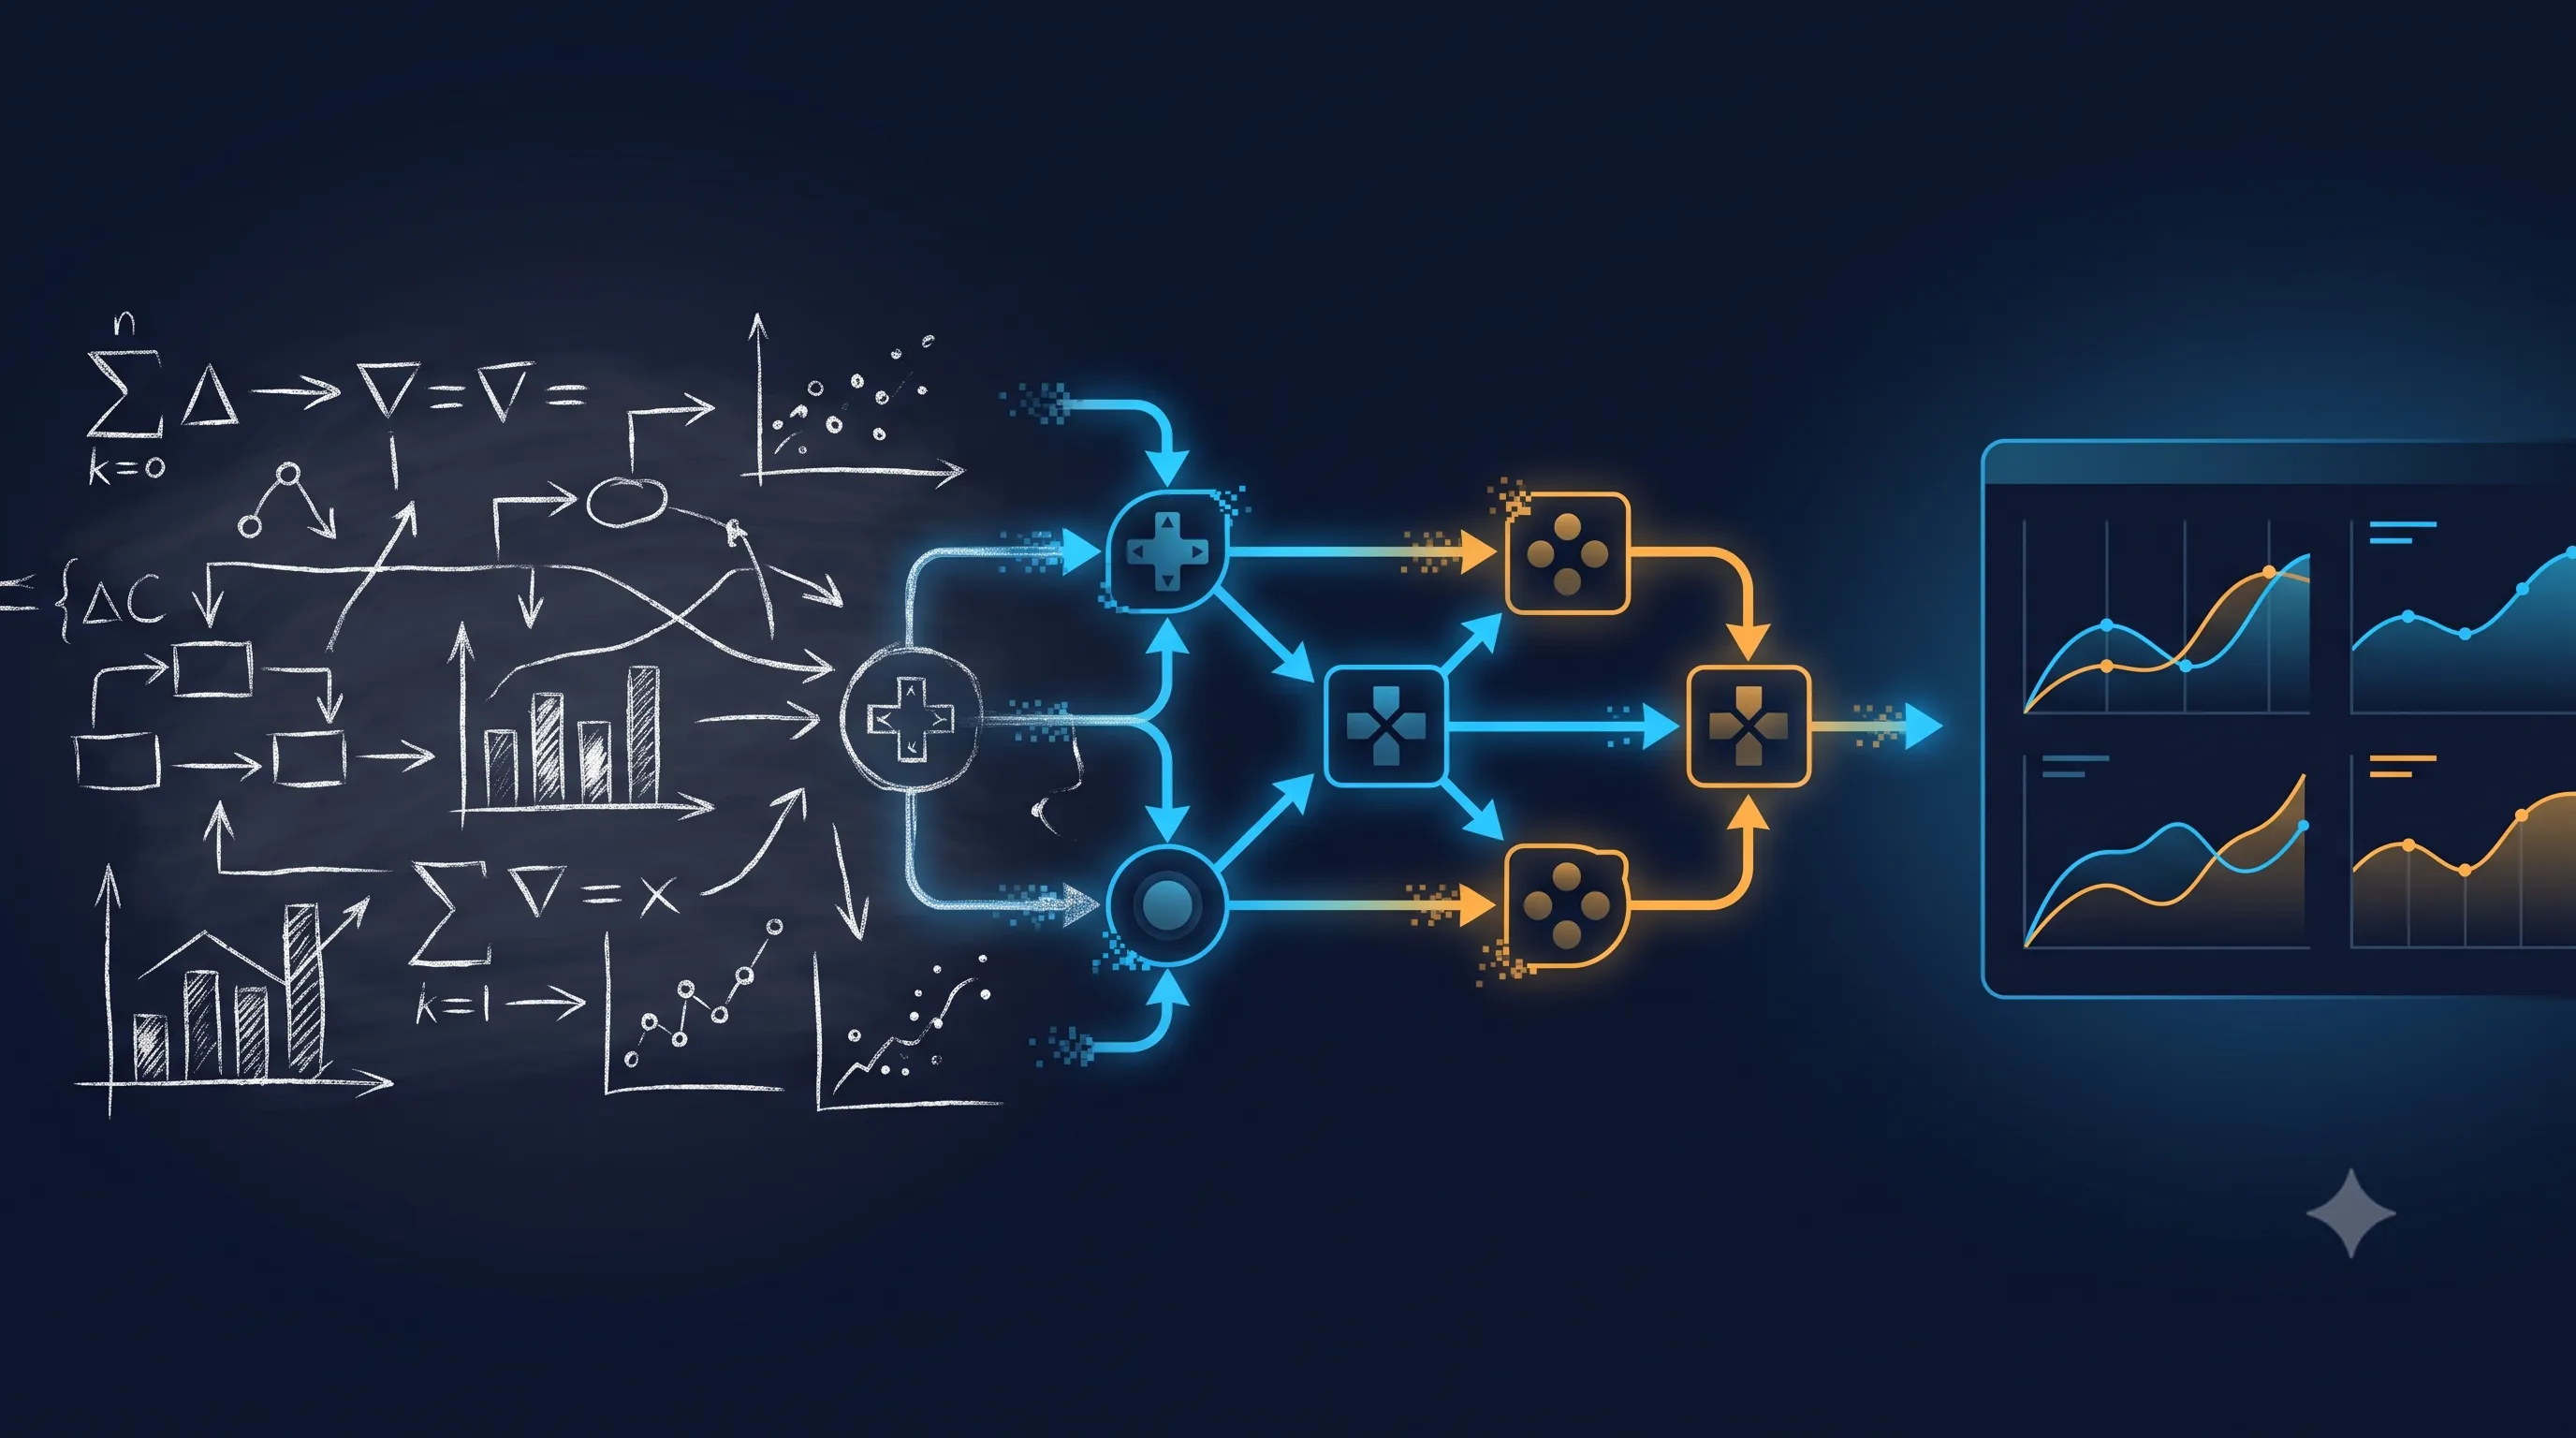
On the data side, a PySpark notebook runs every hour on Databricks, reading the event table from our games, a table that is fed continuously, in streaming, by everything that happens inside them. Among millions of events, the job looks for a specific pattern: the first events a player sends in their first session, which is what characterizes an install. From each one, it keeps only three pieces of information: the minute it happened, and the latitude and longitude it came from, calculated from the IP. Nothing about who installed, just the point on the map. All of that is saved to a JSON file and published to an S3 bucket.
On the other side, a lightweight Node.js and Express backend reads that file whenever needed and delivers the data to the React web application, the same one running on the TV. No database, no queue, no state: the file on S3 is the single source of truth, and that's what keeps the architecture simple to operate.
The "almost" in "almost in real time" exists for a reason: the pipeline works with a one hour safety window, making sure the data for that period has been processed and published before it shows up on the screen. In practice, what the application shows is the world installing our games, minute by minute, with that small intentional delay.
Since the application stays on all day on a TV, a few details make a difference: a new file only replaces the previous one once it is completely ready (atomic writes), which keeps the screen from reading incomplete data; and if there is any processing delay, the application switches into a replay mode of the recent history, making sure the TV never goes blank.
From a data engineering standpoint, the pipeline is relatively simple. The hard part was somewhere else.
From a flat map to a 3D globe
The most challenging part of the project wasn't the data engineering. It was turning the data into a visual experience.
Front end had never been my territory. During the rebuild, my first approach already solved the functional side: the data was coming through and you could see the installs. But the representation still didn't convey the scale of what those numbers meant. It was a map with correct information that didn't tell a story. It showed the data, but it didn't yet show its impact.
That's when my manager gave me the autonomy to explore a different approach. I decided to use React (a front end framework) with Three.js (a 3D graphics library) to turn that map into something closer to what we wanted to communicate: a living globe, with the Earth spinning slowly and each instal appearing as a point of light in its matching location. The animation follows the clock with a one hour offset: the points lighting up on the globe right now are the installs that happened in this very minute, one hour earlier. When the minute turns, the next minute's installs come in, and so the Earth keeps lighting up at the same rhythm as the world installing our games.
That way the flat map became a globe, and how the Install Tracker took the shape it has today.
The impact went beyond the technical side. Metrics that used to live only in internal dashboards became visible to anyone walking into the office: the result of work from several areas of the company was right there, happening in front of everyone.
And for me, that was the most special part of the project: not just the final result, but the process. I had no experience with that kind of solution, and I was given room to propose a different idea, try things out, make mistakes, and adjust until I reached something that worked. That trust from leadership is something that showed up at many points in my journey here.
From intern to data engineer
Today I work from Campina Grande, remotely, while my team is in São Paulo. And there is something very special about that dynamic: the globe I built keeps spinning on a TV more than two thousand kilometers from here, greeting the people who arrive at the office every day, while I keep taking care of it from a distance, on the other side of the country. I was hired full time on the same team where I interned, after a year and two months, as a natural continuation of a path I had been building from the very beginning. And most importantly, the sense of support never changed. I still have room to learn, contribute, and grow.
Everything I know about Data Engineering I learned here, and I keep learning, because every new project brings me something I haven't mastered yet. My goal is to go deeper and deeper until I become a specialist in the field, and I feel I have real room to build that path: when I mention in my 1:1s that I want to learn about something new, my manager looks for projects, whenever possible, where I can explore it in practice. That changed my view of professional development: here, a project isn't born only out of a need from the team; it can also be born out of a desire to learn. The responsibilities and deliverables are still there, of course. But growth doesn't get pushed to after work hours. It is part of the work.
That's the environment I want to stay in. And Wildlife is where I picture myself continuing this path.
For anyone thinking about applying
My advice is simple: don't wait until you feel 100% ready.
I wasn't either. I started this journey without knowing the field deeply, experiencing various beginnings at the same time: a new city, a new company, and a new career.
What I found out is that being prepared doesn't mean knowing everything before you start. It often means being willing to learn fast, ask for help, and make the most of the opportunities that come your way. That's how it went for me, and I'm still here today.